An anchor is a structure consisting of a tendon free length (designed to satisfy overall structural stability) and a restraint (designed to transmit tensile forces to the surrounding ground).
According to Eurocode 7 (EC7) – Part 1 [2], the design pull-out resistance of an anchorage Ra,d must satisfy the following inequality:
Pd ≤ Ra,d ,where
-Pd is the design load in the anchorage;
-Ra,d is the design pull-out resistance of the anchorage
Two ways of determining the design pull-out resistance Ra,d are discussed in EC7 [2]; the first one refers to the pull-out resistance derived from the results of tests on anchorages and the second one is based on calculations [EN 1997-1 §8.5.1 (2)].
In general, the characteristic resistance of a grouted anchorage is the lowest of the following:
- bond resistance between the grout and ground (external resistance, Ra,k)
- bond resistance between the grout and tendon (internal resistance, Ri,k)
- tensile capacity of the tendon (Pt,k)
- capacity of the anchor head
In this short presentation, we are going to examine the external resistance of a ground anchorage and, more specifically, the methods for estimating the bond strength (qu) between the grout and the surrounding rockmass inserted into the geotechnical design. The case of rock anchorages and related dependencies are also going to be discussed.
The pull-out capacity of an anchor installed in a grouted anchor hole is affected by the size of the anchor hole (i.e., perimeter and length) and the ultimate bond strength, qu. The bond strength is the mobilized shear resistance along the rock-grout interface.
From experience, it is known that for drilled and grouted anchors, the bond strength is affected by the:
- ground conditions around the nail (rock type, water pressure, effective stress field etc);
- anchor installation including:
- drilling method;
- grouting procedure;
- grout nature;
- grout injection (e.g.; gravity, under pressure, etc) and
- size of the grouted zone.
As previously mentioned, the case of anchorages installed in rock and gravity grouting will be discussed.
According to BS 8081 [1], “Anchorage pull–out capacity for a given ground condition is dictated by anchorage geometry. The transfer of stresses from the fixed anchor to the surrounding ground is also influenced by construction technique, particularly the grouting procedure, and to a lesser extent the methods of drilling and flushing”. Four (4) different types of grouting are presented.
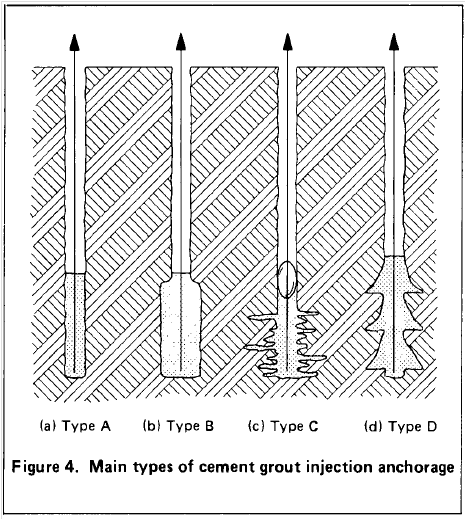 Figure 1: Different types of ground anchorages based on grouting technique according to BS 8081 [1]
Type A anchorages consist of tremie (gravity displacement), packer or cartridge grouted straight shaft boreholes, which may be temporarily lined or unlined depending on hole stability. This type is most commonly employed in rock and very stiff to hard cohesive deposits.
Type B anchorages consist of low pressure (typically grout injection pressure pi < 1000 kN/m2) grouted boreholes, via a lining tube or in situ packer, where the diameter of the fixed anchor is increased with minimal disturbance as the grout permeates through the pores or natural fractures of the ground.
Type C anchorages consist of boreholes grouted to high pressure (typically pi > 2000 kN/m2), via a lining tube or in situ packer. The fixed anchor length is enlarged by hydrofracturing of the ground mass to give a grout root or fissure system beyond the core diameter of the borehole.
Type D anchorages consist of tremie grouted boreholes in which a series of enlargements, either bells or underreams, have previously been formed. This type is employed most commonly in firm to hard cohesive deposits.
Whilst anchorage types A to D can all be applied in rock, the straight shaft tremie or packer grouted type A is the more popular in current practice, on the basis of cost and simplicity of construction.
According to BS 8081 [1], “For weak rocks where the unconfined compressive strength is less than 7 ΜPa, UCS tests on representative samples should be carried out. In such cases, the ultimate skin friction proposed for design should not exceed the minimum shear strength. For strong rocks where there is an absence of shear strength data or field pull–out tests, the ultimate skin friction may be taken as 10 % of the unconfined compressive strength (UCS) of the rock up to a maximum value of 4.0 MPa or 4,000kPa.”
According to FHWA0-IF-03-017 [3], “Typical values of ultimate bond for drilled and grouted nails installed in various soils and using different drilling methods are presented in Table 3.10. The values in this table correspond to gravity grouting only. Table 3.10 allows the designer to estimate bond strengths by entering the name of common rock types and soils described by their geologic origin (e.g., colluvium, moraine, etc.) and the construction (drilling) method employed.
Although Table 3.10 covers a wide variety of rock/soil types, drilling methods, and ground conditions, the database used to develop the table does not cover all the possible case combinations.“
Table 1 (3.10 – FHWA [3]): Estimated Bond Strength of Soil nails in Soil and Rock (Source: Elias and Juran, 1991)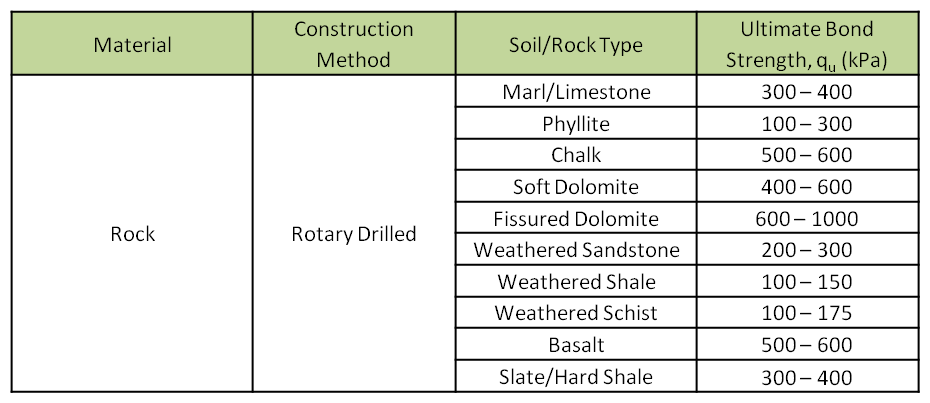 Notes: Convert values in kPa to psf by multiplying by 20.9 / Convert values in kPa to psi by multiplying by 0.145
International literature provides a wide range of empirical correlations for the estimation of ultimate shaft resistance based on the compressive strength of rock (UCS). It must be noted that the anchors are considered as small-diameter piles bored into the ground as a simplistic approach.
The following three empirical correlations are discussed in this note.
(1) Meigh and Wolski (1979): 0.22(UCS)0.6
(2) Carter and Kulhawy (1987): 0.15(UCS)
(3) Reese and O’Neil (1988): 0.15(UCS), for UCS<1.9MPa and 0.20(UCS)0.5, for higher UCS
Three typical rock types will be examined as an example. These are Basalt, Limestone and Weathered Shale. The typical values of these types of rock materials are summarized in Table 2, below.
Table 2: Rock types and geotechnical properties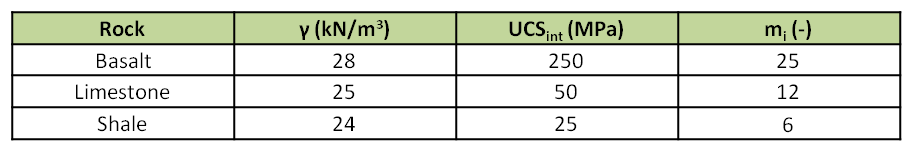 Note: Typical values for unit weight and UCSint / mi are taken from international literature and RocLab software (RocScience), respectively.
The following table summarizes the estimated ultimate bond strength (qu) based on the aforementioned international standards and literature.
Table 3: Estimated ultimate bond strength, qu (kPa)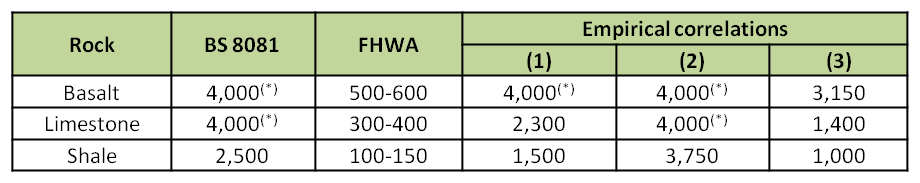 (*) Limited as per BS 8081 recommendations
Taking into account the generic in situ conditions of a rockmass (weathering, fracturing) and the modified Hoek and Brown criterion [4] the following values for the ultimate compressive strength of the rockmass (UCSrm) are calculated for a slope of 10-30m high, a GSI range of 40 to 60 (typical for these types of rocks) and a disturbance factor of 0. It has to be noted that regarding the disturbance factor and according to Hoek E. [5], a value of 0 has been considered as more representative since the bonded length of an anchor extends beyond the excavation face (disturbed zone) and the small hole diameters guarantee a minimum disturbance of the surrounding rockmass.
Table 4: Rock types and geotechnical properties for rockmass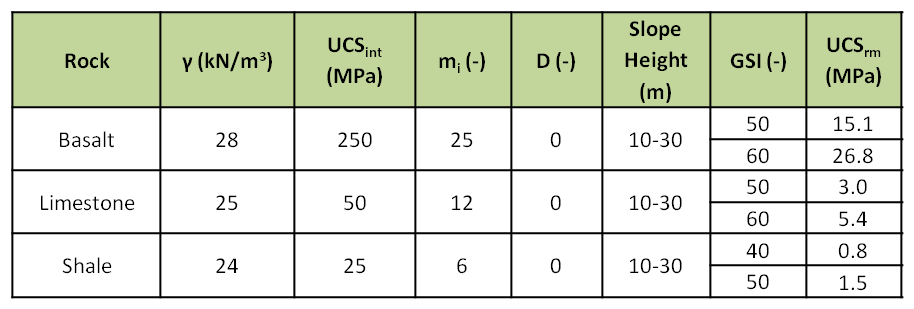
The ultimate bond strength has been recalculated based on the values for the rockmass and the results are summarized in the following table.
Table 5: Estimated ultimate bond strength, qu (kPa), for rockmass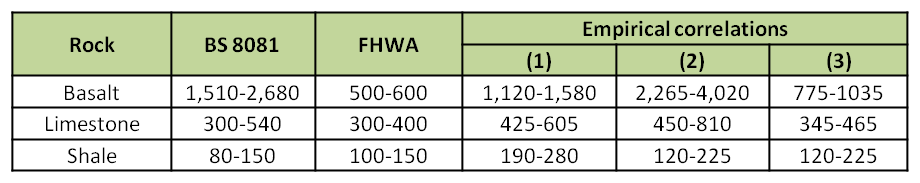
According to Ostermayer H. and Barley T. [6], the following values of the ultimate bond strength are proposed for rock type materials depending on their weathering, mineral bonding and spacing of rock joints.
Table 6: Estimated ultimate bond strength, qu (kPa), for rockmass (Ostermayer and Barley)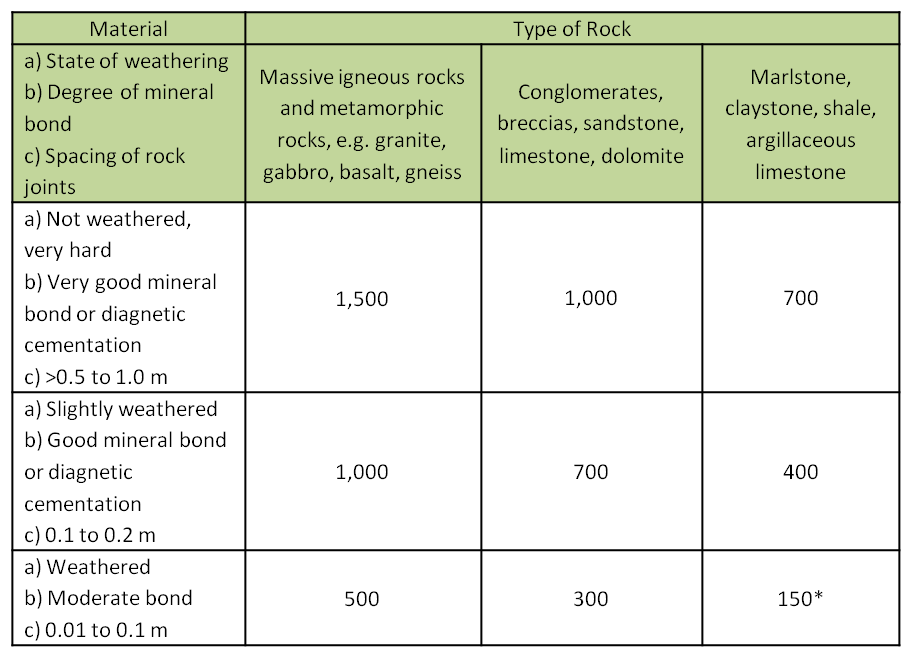
Conclusions-Recommendations
There are many international standards and literature references with regards to the ultimate bond strength estimation for rock anchorages. The above short study presented and discussed several of them and concluded that the FHWA guidance (Elias and Juran, 1991) and the recommendations by Ostermayer and Barley correlate well with all empirical equations examined when the unconfined compressive strength of the rockmass is used instead of the intact one meaning that weathering and joints characteristics/condition are taken into account. Moreover, the equation proposed by Reese and O’ Neil correlates better with the above mentioned recommendations.
In all cases, according to Ostermayer H. and Barley T. [6], for bonded lengths more than 6m, the progressive debonding phenomenon should be taken into account and the recommended values should be reduced accordingly.
It must be noted that due to the high dependency of the bond strength to the rockmass unconfined strength, the second must be carefully estimated based on detailed site investigation. However, based on available research studies and international literature [7] there are other factors that affect the mobilization of the bond strength of drilled shafts such as the rockmass elasticity, the diameter of the shaft, and the initial normal stress of concrete which have not been taken into consideration in this note for simplicity reasons.
Further to that, Carter et al. (2008) [8] have established that the Hoek-Brown criterion tends to underestimate the shear strength of rock material for the lower end of the rock competency scale (i.e. weak rock); “This is largely because block size and incipient strength is such that rock mass behavior in these domains tends not to be controlled by interlock shear strength but rather by material strength. At the low end of the rock competence scale (UCSint <15MPa and GSI generally <30) discontinuities play less of a role and rockmass strength tends to matrix strength.” This means that rockmass properties estimated based on the Hoek-Brown criterion as modified by Carter et al. are considered to be more representative and, in general, will lead to a more economic design.
It must be highlighted that the above note and its recommendations are to be read in conjunction with site specific available information and engineering judgment must be implemented in all design stages.
In all cases, the Designer should set strict guidance for adequate testing prior to anchors installation and proof/verification tests should be conducted to ensure the proper installation by the Contractor in line with project specifications and international standards.
The views expressed in this note are only informative and must be used with great care in design situations.
References
[1] BS8081:1989, British Standard Code of practice for Ground anchorages
[2] EN 1997-1, Geotechnical Design
[3] Carlos A. Lazarte, Ph.D., P.E., Victor Elias, P.E., R. David Espinoza, Ph.D., P.E., Paul J. Sabatini, Ph.D., P.E. (2003), “Geotechnical Engineering Circular N0. 7 – Soil Nail Walls”, Publication FHWA0-IF-03-017, Federal Highway Administration, Washington D.C.
[4] Hoek, E., Carranza-Torres, C.T. and Corkum, B. (2002), “Hoek-Brown failure criterion – 2002 edition”, Proc. North American Rock Mechanics Society meeting in Toronto in July 2002.
[5] Hoek, E. (2012), “Blast Damage Factor D”, Technical Note for RocNews, Winter 2012 Issue.
[6] Ostermayer H., Barley T. (2002), “Geotechnical Engineering Handbook, Volume 2: Procedures”, Ernst & Sohn Publications.
[7] Khaled H. Sharif, Shadi S. Najjar, Salah Sadek (2010), “Side Friction along Drilled Shafts in Weak Carbonate Rocks”, Art of Foundation Engineering Practice, ASCE.
[8] Carter, T.G., Diererichs, M.S. & Carvalho, J.L. (2008), “Application of modified Hoek-Brown transition relationships for assessing strength and post yield behavior at both ends of the rock competence scale”, 6th Int. Symposium of Ground Support in Mining and Civil Engineering Construction.


