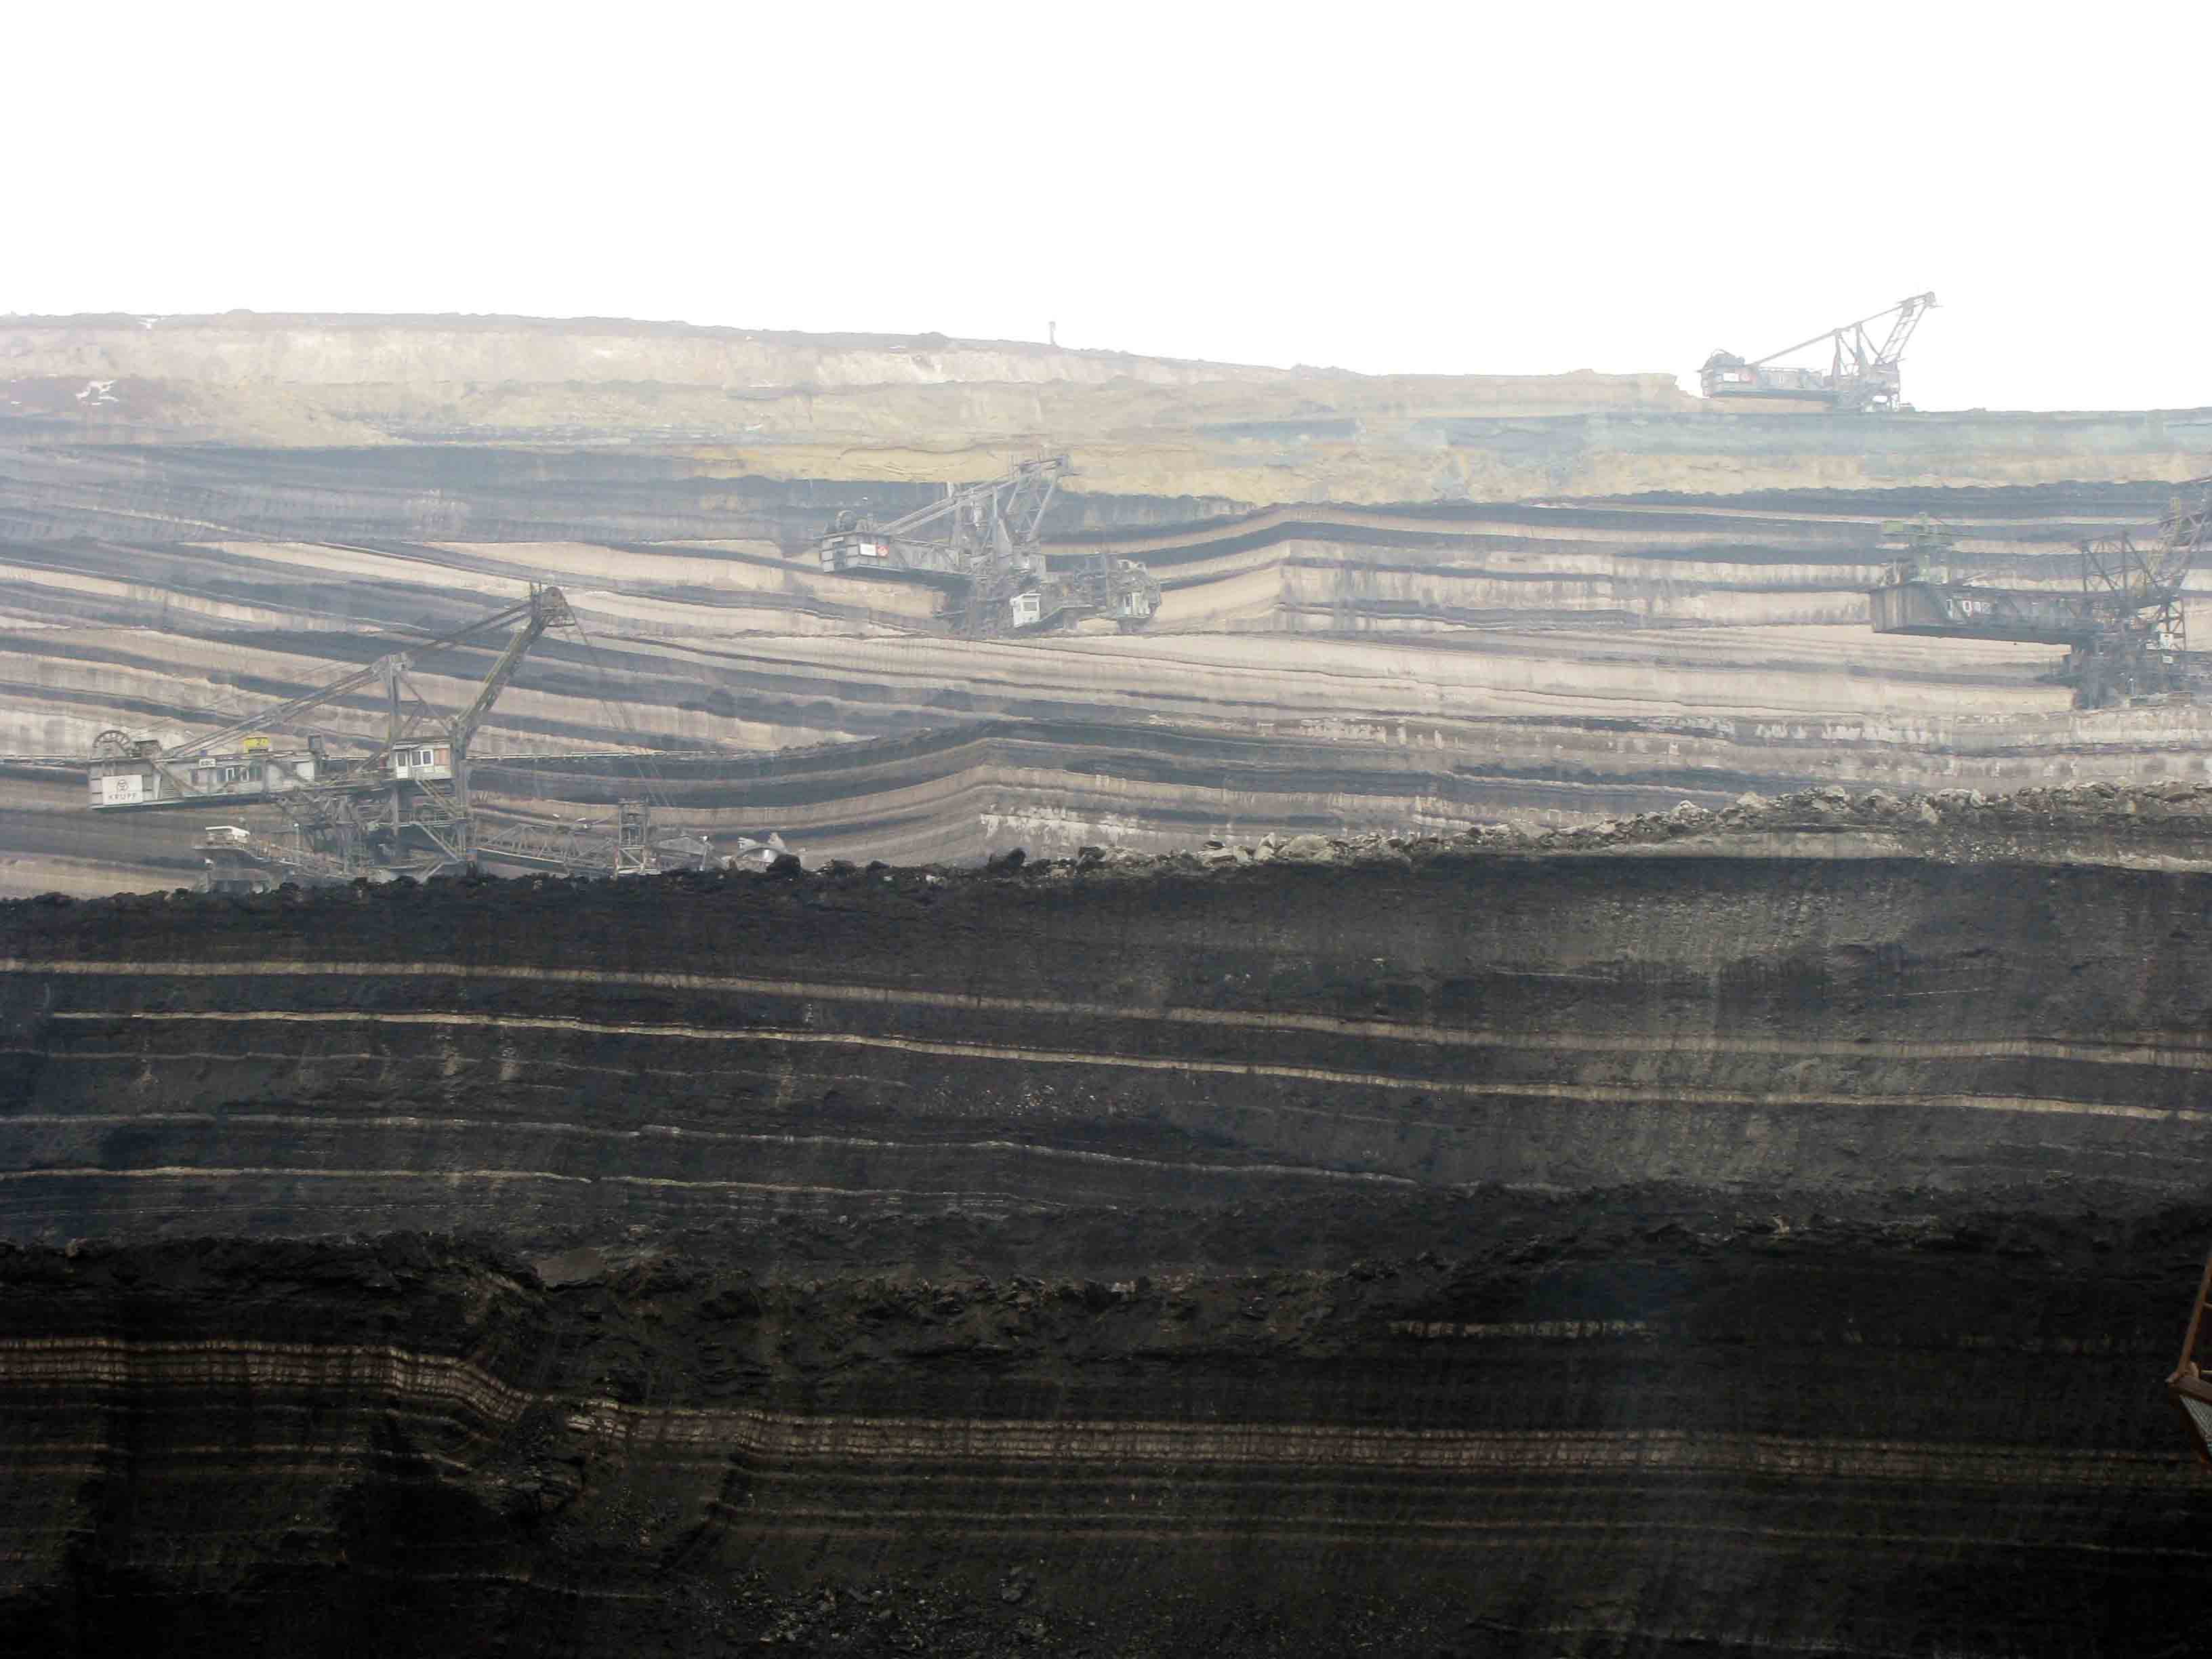
On 11 of April 2013, around 9:30 p.m. a large slide (maybe the largest) in the northeast section of the Kennecott mine occured (fig 1). The slide was preceded by slope movements that reached ~50mm per day. Two major questions could be raised, why this slide occurred and could it have been predicted before hand and remediated?
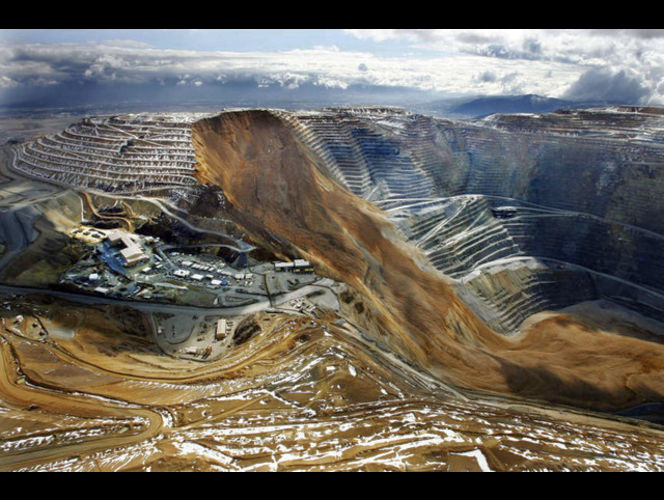
These are very difficult questions and require significant knowledge of the geology, geotechnical conditions of the area, operational practices, climatic conditions etc. In the following paragraphs some initial ideas regarding the stability of high mine slopes and some interesting references will be provided for interested individuals. The incident in Kennecott is an important lesson of how important continuous monitoring of slopes is in such mine operations.
I would like to start with a very interesting graph published by Hoek et al (2000), “Large-scale slope Design – A Review of the State of the Art”.
This chart presents slope height versus overall angle with solid markers representing unstable slopes and open markers represent stable slopes. This chart is for copper porphyry open pits. In this graph the Kennocott mine (Bingham Canyon) is also shown but not the April 2013 one.

It is very interesting to note that most of the unstable markers are located in a range between 35 and 45 degrees of slope angle. Although much information is required for detail evaluation of each point and why instability occurred, a trend can be seen. Can we assume that slopes designed bellow 32-35o would not provide stability problems?
In the next figure I would like to focus on scale effects when dealing with mine slopes in rock or even hard rock materials. In the down left side of the figure 2 a slope with 30 meters height is depicted. In the upper left one of 90m with the same spacing of joints and finaly on the right a slope of 500m again with the same spacing and trance length of discontinuities (figures adopted from Sjoberg, 1996).

What can be seen from this slope scale is that even solid lightly fractured hard rock can be seen as an accumulation of infinite rock items such as a gravel slope or sand slope, just with better interlocking. One additional question can be, “what is the effect of bridging (intact rock between discontinuities) in such large scale slopes”? Very difficult question but maybe the previous graph provides an explanation (maybe negligible?).
Is the scale effect, in relation to joint spacing, orientation and stress field producing a ductile (sand or gravel like) behavior that may control the overall stability?

In the left graph (Ross, 1949) tests on intact marble with different confining pressures are presented. On the right (Holtz, 1981) normalized stress – strain with different confining pressures for dense Sacramento sand are presented. As can be seen, both materials in low confining pressures present a brittle behavior and as confining pressure increases, the behavior becomes more ductile and strain hardening.
Strong rock and dense sand can have the same behavior in different stress scale? And if this is the case, should high slopes be treated in a different way? Neglecting cohesion and using a possible “critical state friction angle” approach in slope stability? This issue requires additional research and detailed case studies but at least we can have some perspective regarding to scale effects.
References:
Sjoberg J., (1996). Large scale slope stability in open pit mining – a review. Technical Report 1996:10T, Lulea University of Technology
Hoek E., Rippere K. H. and Stacey P.F. (2000). Chapter 1, Slope stability in surface mining, Hustrulid, McCarter, VanZyl (eds), Society for Mining, Metallurgy and Exploration
Ros Μ. und Eichinger Α. (1949). Die Bruchgefahr fester Korper (Eidgenoss. Material prufungs versuchsanstalt, Ind., Bauw. Gewerbe. ZUrich, l72), 246 pp.
Holtz R. D., Kovacs W. D., (1981). “An Introduction to Geotechnical Engineering”, Prentice Hall.

